Inventory Analysis
Inventory analysis is the regular auditing of inventory in the pursuit of continuous improvements to how it is managed. This can be done through a variety of commonly used inventory KPIs and ratios.
Regular monitoring of these metrics is a key part of inventory management, and so we explore each method in-depth within this article.
The goals of inventory analysis
Before getting into any metrics, it’s important to understand what the specific goals are when it comes to doing inventory analysis.
The general objective is to improve overall inventory efficiency. But breaking this down even further would involve aiming to:
Identify improvement areas: Metrics should be compared to past results and industry benchmarks to identify where problem areas lie.
Reduce stock-outs: Stock-outs should be seen as huge red flags for retailers, and inventory analysis will help minimize them as much as possible.
Improve cash flow: Analysing inventory now will prevent sinking too much cash into stock at any one time going forward.
Waste less inventory: Analysis and improvements will help minimize inventory shrinkage, such as stock that gets lost, stolen or damaged beyond repair.
This all has the bottom line effect of making the business more profitable, while also improving the experience for customers.
ABC analysis
ABC analysis is a commonly used inventory analysis method that helps to identify your most valuable inventory.
It’s based on the Pareto principle - AKA the 80/20 rule. Applied to retail, this would suggest that around 80% of sales would typically come from 20% of a company’s total inventory.
ABC analysis uses this theory to sort inventory into three buckets:
A inventory
Inventory with the highest value - typically your 20% that brings in 80% of sales/profits. These are usually items with the best profit margins and/or most sales revenue.
B inventory
Inventory that sells regularly, but doesn’t have quite as much value as A - often due to having slimmer margins or higher carrying costs.
C inventory
The remainder of inventory that doesn’t sell as much as A or B, generates the least revenue and is generally least valuable.
This kind of analysis helps identify the key players in a retail business’s inventory.
A inventory, for example should rarely (if ever) stock-out and be given the highest priority and focus. While C inventory may not warrant quite so much attention.
Inventory analysis metrics
ABC analysis isn’t the only way to draw conclusions from your inventory. There are several key metrics that can be used to measure performance and uncover ways to optimize operations.
1) Average inventory
Average inventory measures the average volume of inventory kept on-hand throughout a given period.
It comes from adding together the beginning inventory (BI) value at the start of a period and the ending inventory (EI) value at the end of the period. Then simply dividing by two to find the average:
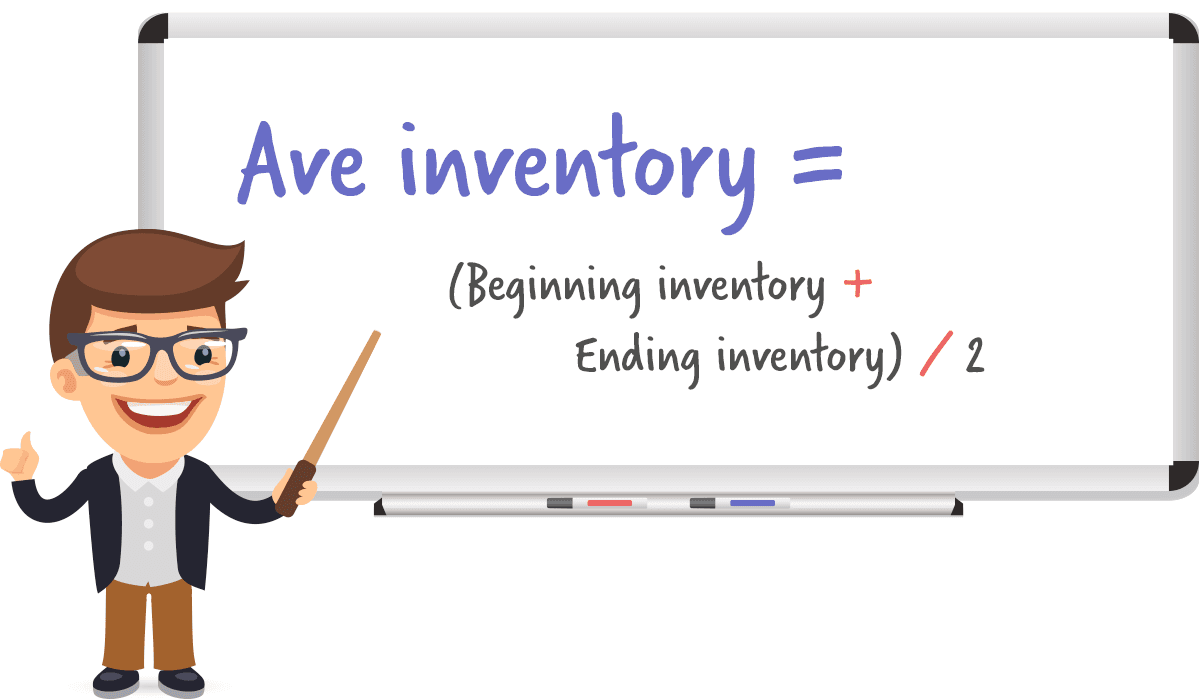
This helps to even out seasonal fluctuations to see whether too much or too little inventory is typically kept on-hand at any one time.
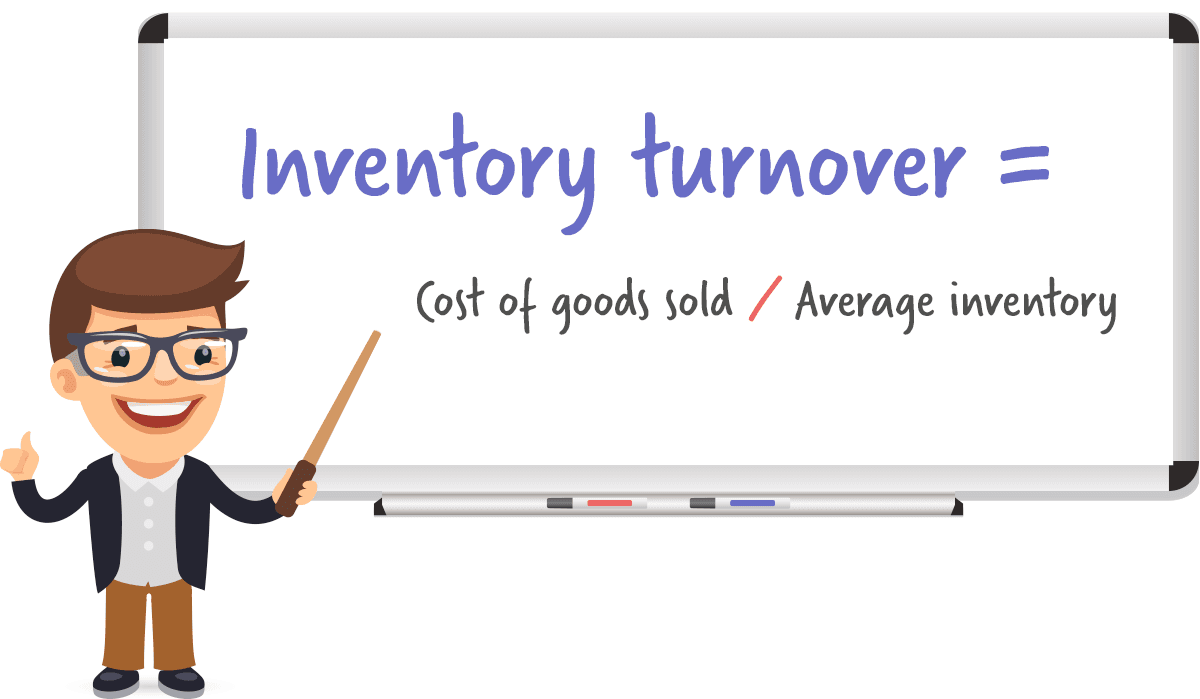
2) Inventory turnover
Inventory turnover measures how many times your inventory is sold over a given time period. It’s therefore a critical metric showing how effectively inventory is being managed overall.
The formula takes cost of goods sold (COGS) over a specific period, and divides it by average inventory over the same period:
This is affected by two key factors:
Purchasing: Getting forecasting and inventory buying correct to ensure the right amount of stock is purchased in the first place.
Sales: Ensuring the marketing and conversion sides of the business are on point in order to back up the projected sales with actual orders.
Poor inventory turnover performance could be stemming from failures in either one (or both) of these elements.
Generally speaking, higher inventory turnover rates indicate better performance and efficiency. This is because the company would be getting through its inventory stocks more often - minimizing carrying costs per unit.
3) Inventory write-off
Inventory write-off is a measure of any unsold inventory that has become defunct or no longer has any value for the business over a given period. Usually due to loss, theft, damage or generally becoming obsolete and unsellable.
It involves identifying the inventory, disposing of it and officially writing off its value in accounting records. So is more a procedure and final value, rather than a specific formula.
But it’s worth regularly reviewing and tracking how much inventory is being written-off.
High or continually increasing amounts could indicate problems with forecasting for certain products, or how inventory is being stored in the warehouse.
4) Gross margin return on investment (GMROI)
GMROI is a simple ratio to measure the profitability of your inventory over a certain period. It gives the gross profit a retailer makes for every dollar of inventory that’s purchased.
Here’s the formula:
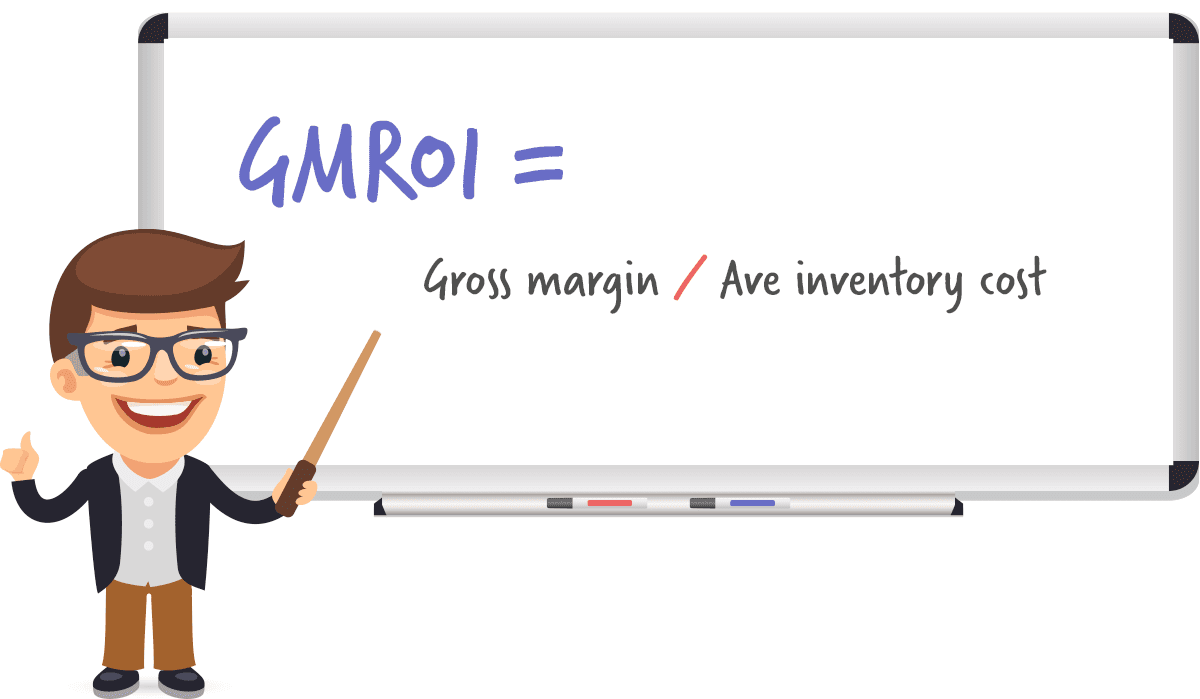
(Note: gross margin is found by subtracting COGS from net sales.)
Any GMROI ratio below 1.0 means a business is not profitable, and is losing money for every dollar invested in inventory. Anything above 1.0 means a business is selling goods for more than what it costs the firm to acquire them.
It’s important to note that this is not a measure of bottom-line profitability - as only COGS is taken into account as a cost, not total expenditure.
But this does give a clear indication as to how profitable your inventory is with current price points and buying procedures.
5) Sell through rate
Sell through rate takes the amount of inventory a retailer receives, and compares it against what is actually sold over a given period. It’s usually expressed as a percentage:
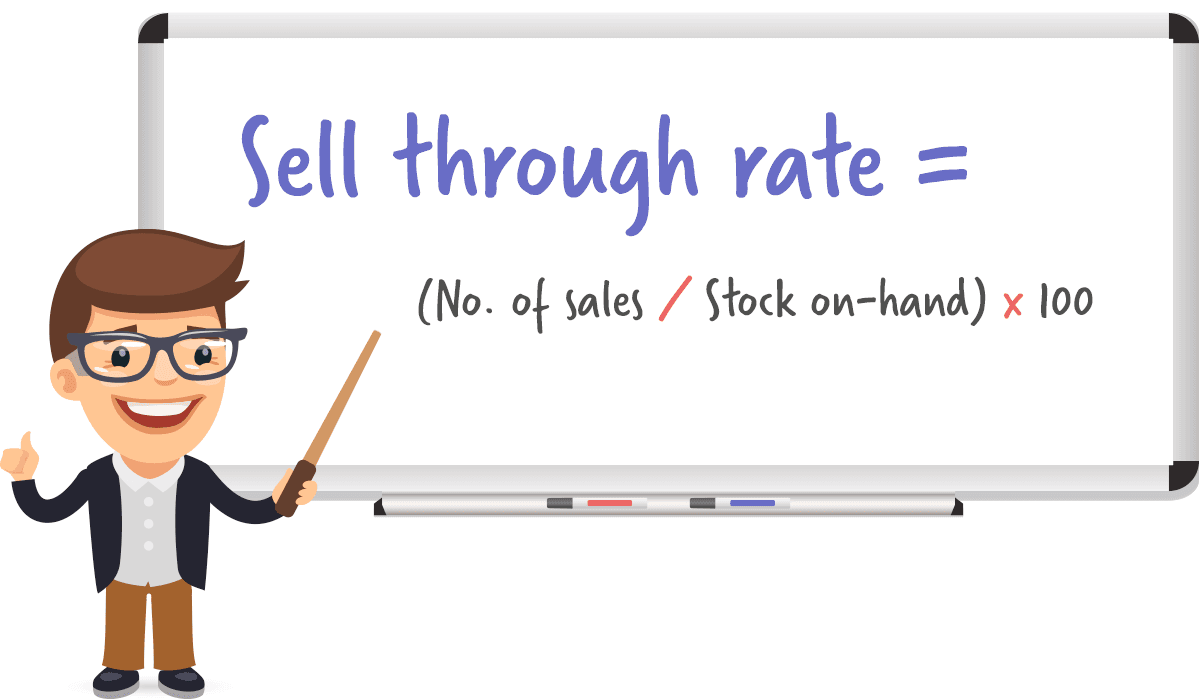
This can be used on a ‘per product’ (or even ‘per variant’) basis to analyze how quickly the investment in inventory is paying off.
It’s useful when comparing one product or variant against another. Or when comparing the sell-through of a specific product from one month to another.
Low sell through rates indicate you either overbought or priced too high, while high sell through rates indicate you may have under bought or priced too low.
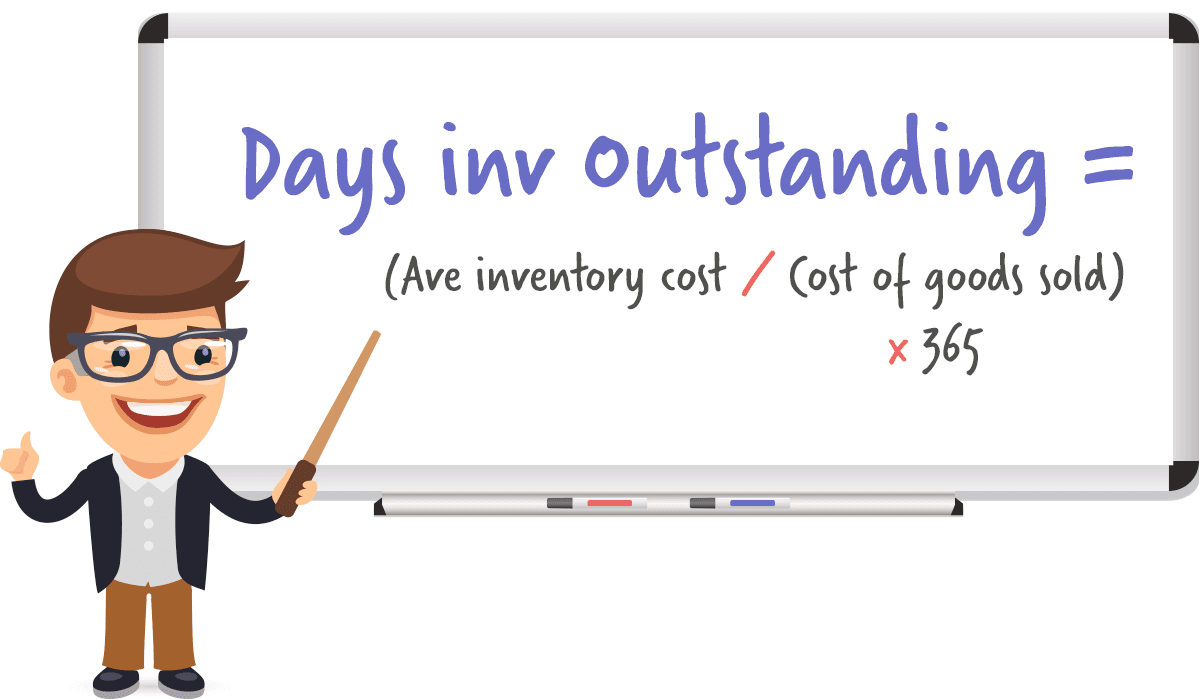
6) Days inventory outstanding (DOI)
Days of inventory outstanding (DOI) is simply how many days it typically takes to create or buy inventory and turn it into a sale. It’s even sometimes referred to simply as average days to sell.
The formula involves dividing average cost of inventory over a time period by COGS over the same period, then multiplying by number of days in the time period (all usually a year):
It’s hard to draw insights from just one calculation. But you should look into typical industry standards, and also keep track of whether you are trending up or down as time goes on.
Increases and/or poor performance could indicate a problem with manufacturing/purchasing and/or the sales process.
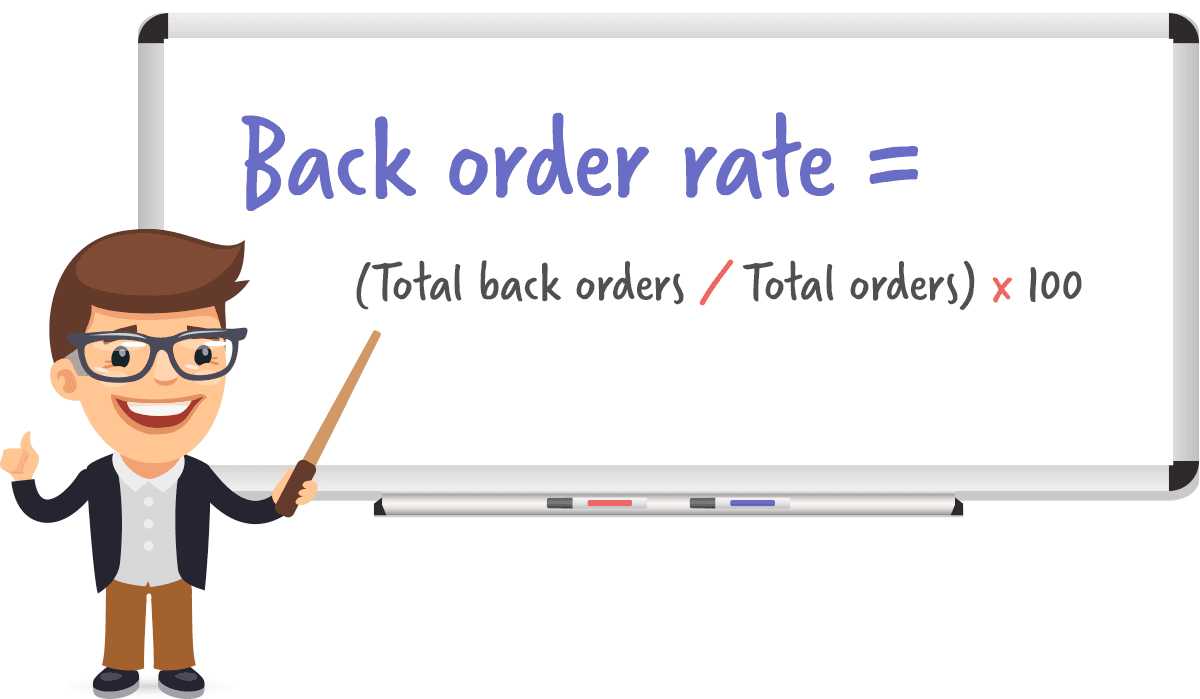
7) Back order rate
Back order rate shows the percentage of your total orders over a given period that ended up being placed on back order.
This gives an indication of how well you forecast, replenish and track inventory. A high back order rate could stem from:
Not buying the right amount of inventory.
Not re-ordering at the right time.
Not syncing and tracking multichannel inventory efficiently enough.
As well as a host of other reasons.
However, it’s also important to note this doesn’t account for sales that may have been lost from poor inventory management. You could still have a zero back order rate, but have lost sales from having to mark online store products as ‘pre-sale’ or ‘out-of-stock’.
Conducting inventory analysis
Inventory analysis is not about simply looking at these equations once. It’s about setting aside regular time to properly track, monitor and draw conclusions from them.
It’s worth creating a spreadsheet, then setting aside monthly time to compare trends and truly analyze the data.
Good inventory management software should come with extensive reporting features. Allowing you to automatically track and easily pay attention to vital KPIs within the platform.
Veeqo, for example, lets you run all kinds of reports. From sales:
To products and inventory:
Right through to warehouses and team performance.
This chapter should have provided you with some key insights on how to analyze and understand your inventory better. The next chapter will focus on the crucial inventory management techniques you need to know about to handle stock in the most optimal way possible. You may also be interseted in the best way to do inventory counts our inventory control guide.
